Metrics export now live
Exporting metrics has been a most requested feature by our users, and for good reason. Having Postgres metrics show up in the same dashboards as your app and infrastructure saves you time and headaches. This post walks through how we built native metrics export in Neon using OpenTelemetry Collectors, so you can stream real-time Postgres insights into Datadog, New Relic, and others.
Console Monitoring: Our First Step in Observability
Before building native metrics export, we started by giving users visibility directly in the Monitoring dashboard in the Neon console.
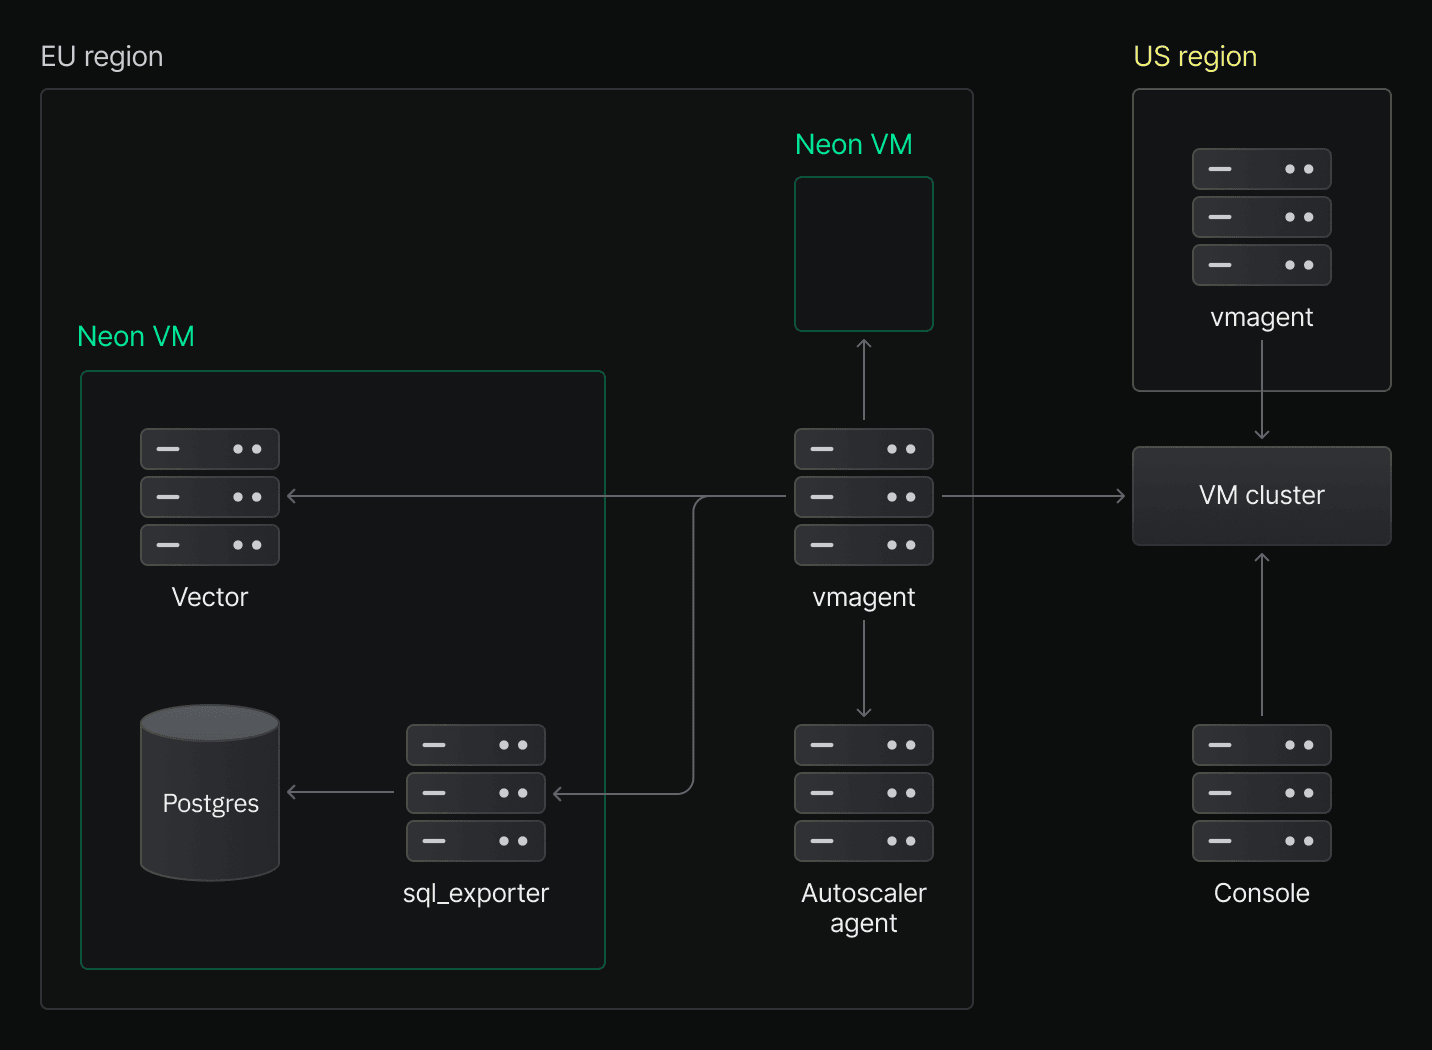
Our Monitoring page shows key performance and system metrics collected from every running compute node in our Kubernetes clusters. We use vmagent to automatically scrape these metrics from all active Compute pods. Each pod runs two exporters:
- sql_exporter, which queries Postgres for database metrics (full list here)
- Vector, which collects host-level system metrics (CPU, RAM)
Our Autoscaler agents manage NeonVMs and adjust their resources dynamically based on load. These agents also expose autoscaling metrics, such as the configured min/max limits, which we scrape as part of the pipeline.All collected metrics are stored in a self-hosted VictoriaMetrics (VM) cluster. The console queries this cluster to render live graphs on the Monitoring page.
info
Here’s an overview of the infrastructure behind the Monitoring page:
The Journey to Metrics Export
The Monitoring page in the Neon console was a good start, but it was limited. Many users needed raw access to metrics so they could build custom dashboards, set alerts, and combine database metrics with the rest of their infrastructure data.
First idea: let users scrape their own metrics
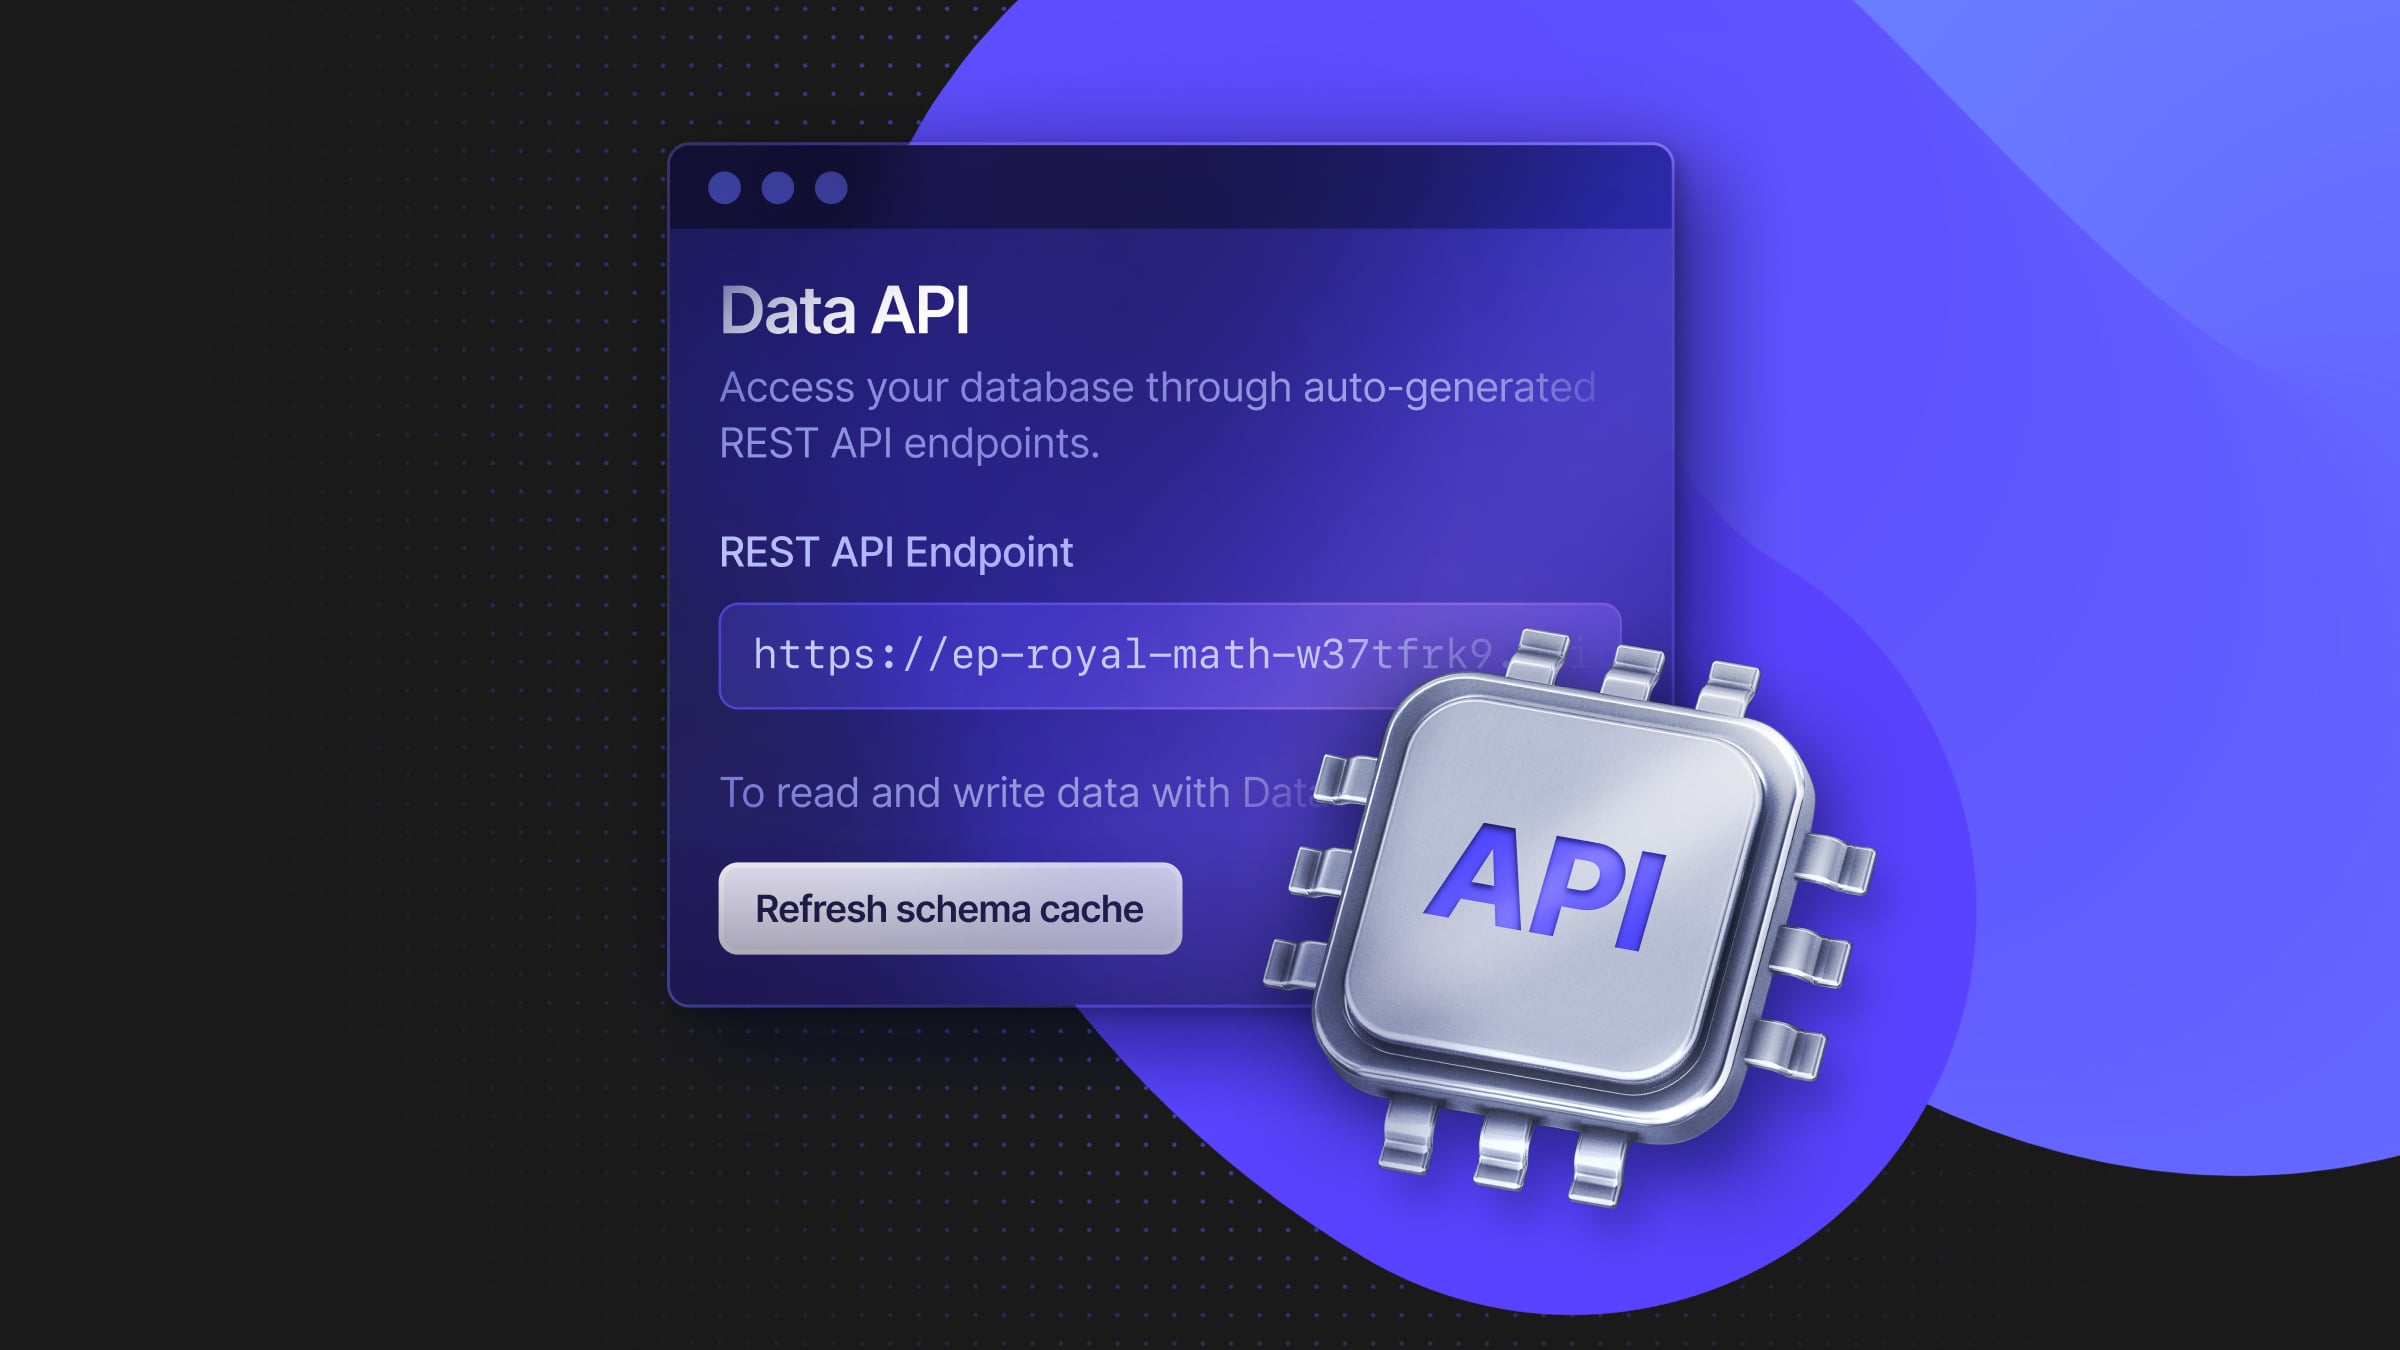
Our first approach was to expose a Prometheus-compatible endpoint that users could scrape themselves.
This would work, but it would also require every customer to set up and operate their own scraper infrastructure. That’s not ideal. We wanted a smoother, lower-friction solution that could be enabled with a click.
Second idea: we scrape it for you
Instead, we decided to run the scraping infrastructure ourselves and export metrics directly to third-party platforms like Datadog.
We chose the OpenTelemetry Collector as the backbone of this system. Even though we already run several Vector agents for internal use, OTel offered several advantages:
- It supports virtually all observability platforms via OTLP
- It provides a flexible pipeline for metrics ingestion, processing, and export
- It comes with a Kubernetes Operator that simplifies deployment and management
Why per-project collectors?
At first, we considered deploying one collector per user or organization. But Neon users can create databases in multiple regions, and scraping across regions would add latency and introduce potential network failures.
The better approach was to run collectors per project, colocated with the compute pods in each region. This architecture ensures low-latency access to metrics and keeps failure domains isolated.
How the OpenTelemetry collector works
The OpenTelemetry Collector acts as a metrics pipeline:
- Receivers collect data (e.g., from sql_exporter and vector)
- Processors apply limits, batching, and filtering
- Exporters forward metrics to destinations like Datadog
We use the Kubernetes Operator to provision each collector. All we have to do is define a custom resource (CRD), and the operator handles deployment and configuration.
Here’s a sample OTel collector configuration to illustrate the concepts:
receivers:
  prometheus/neonvm:
    # Don't export metrics related to scraping itself, e.g. scrape duration.
    report_extra_scrape_metrics: false
    config:
        - job_name: "sql-metrics"
          scrape_interval: 30s
          metrics_path: /metrics
          scheme: http
          # Find pods in default namespace that have labels
          # - neon/project-id: <project_id>
          kubernetes_sd_configs:
            - role: pod
              namespaces:
                names: [default]
              selectors:
              - role: pod
                label: "neon/project-id=${env:NEON_PROJECT_ID}"

# Protect the collector from sudden spikes in memory usage/metrics.
processors:
  memory_limiter:
    check_interval: 1s
    limit_percentage: 75
    spike_limit_percentage: 15

  batch/datadog:
    send_batch_max_size: 100
    send_batch_size: 10
    timeout: 10s

exporters:
  # https://github.com/open-telemetry/opentelemetry-collector-contrib/tree/main/exporter/datadogexporter
  datadog:
    api:
      key: "${env:DATADOG_API_KEY}"
      site: "${env:DATADOG_SITE}"
      fail_on_invalid_key: true
    host_metadata:
      enabled: false

service:
  pipelines:
    metrics/datadog:
      receivers:
      - prometheus/neonvm
      processors:
      - memory_limiter
      - batch/datadog
      exporters:
      - datadog
What the architecture looks like
Here’s what the full export pipeline looks like in production, with arrows representing the flow of data:
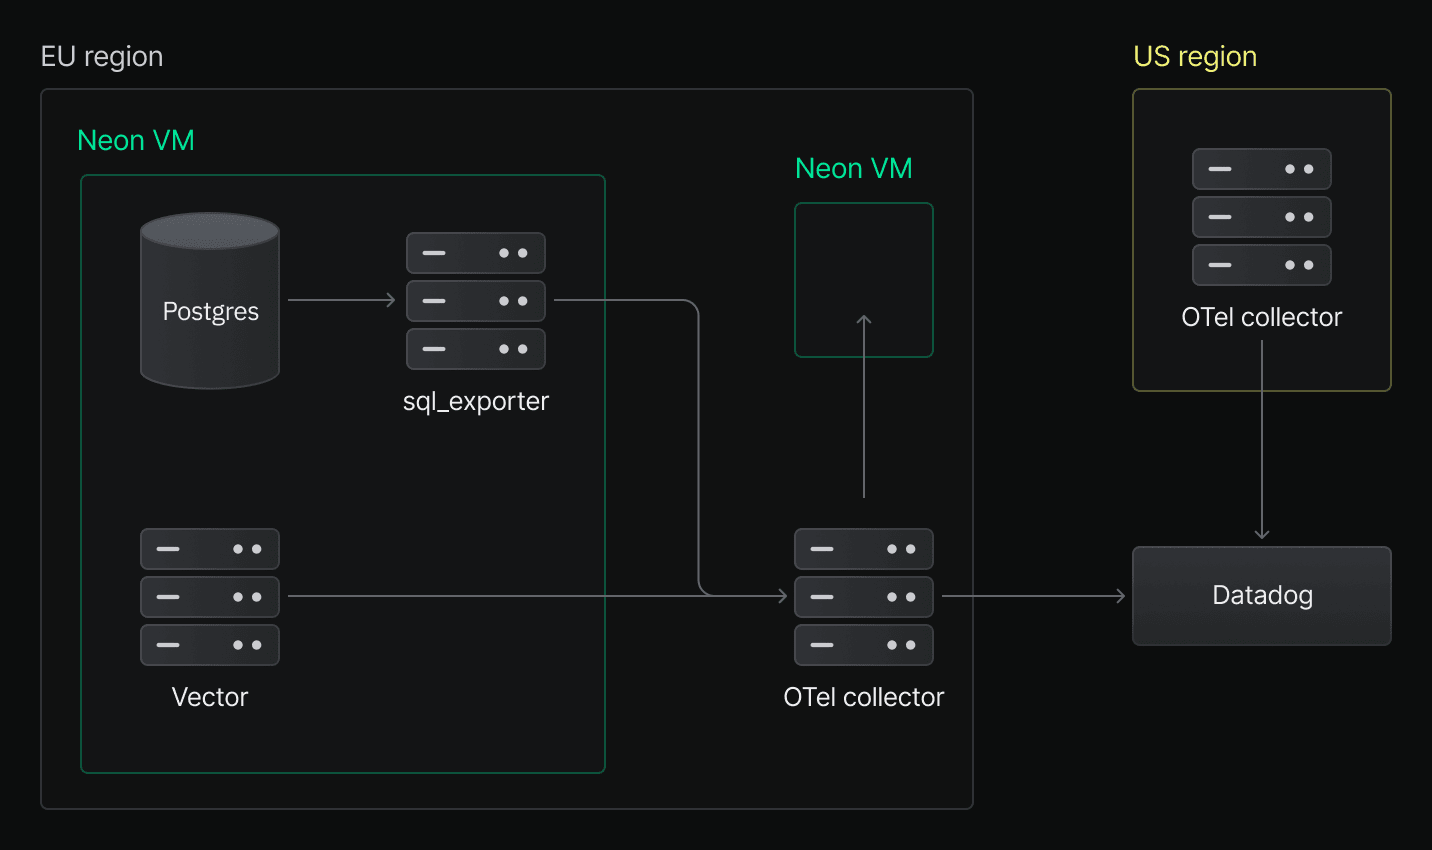
This diagram is nearly identical to our internal metrics collection setup. The key difference is that we now run OpenTelemetry collectors per project, and each collector only scrapes compute pods for that project.
Conclusion
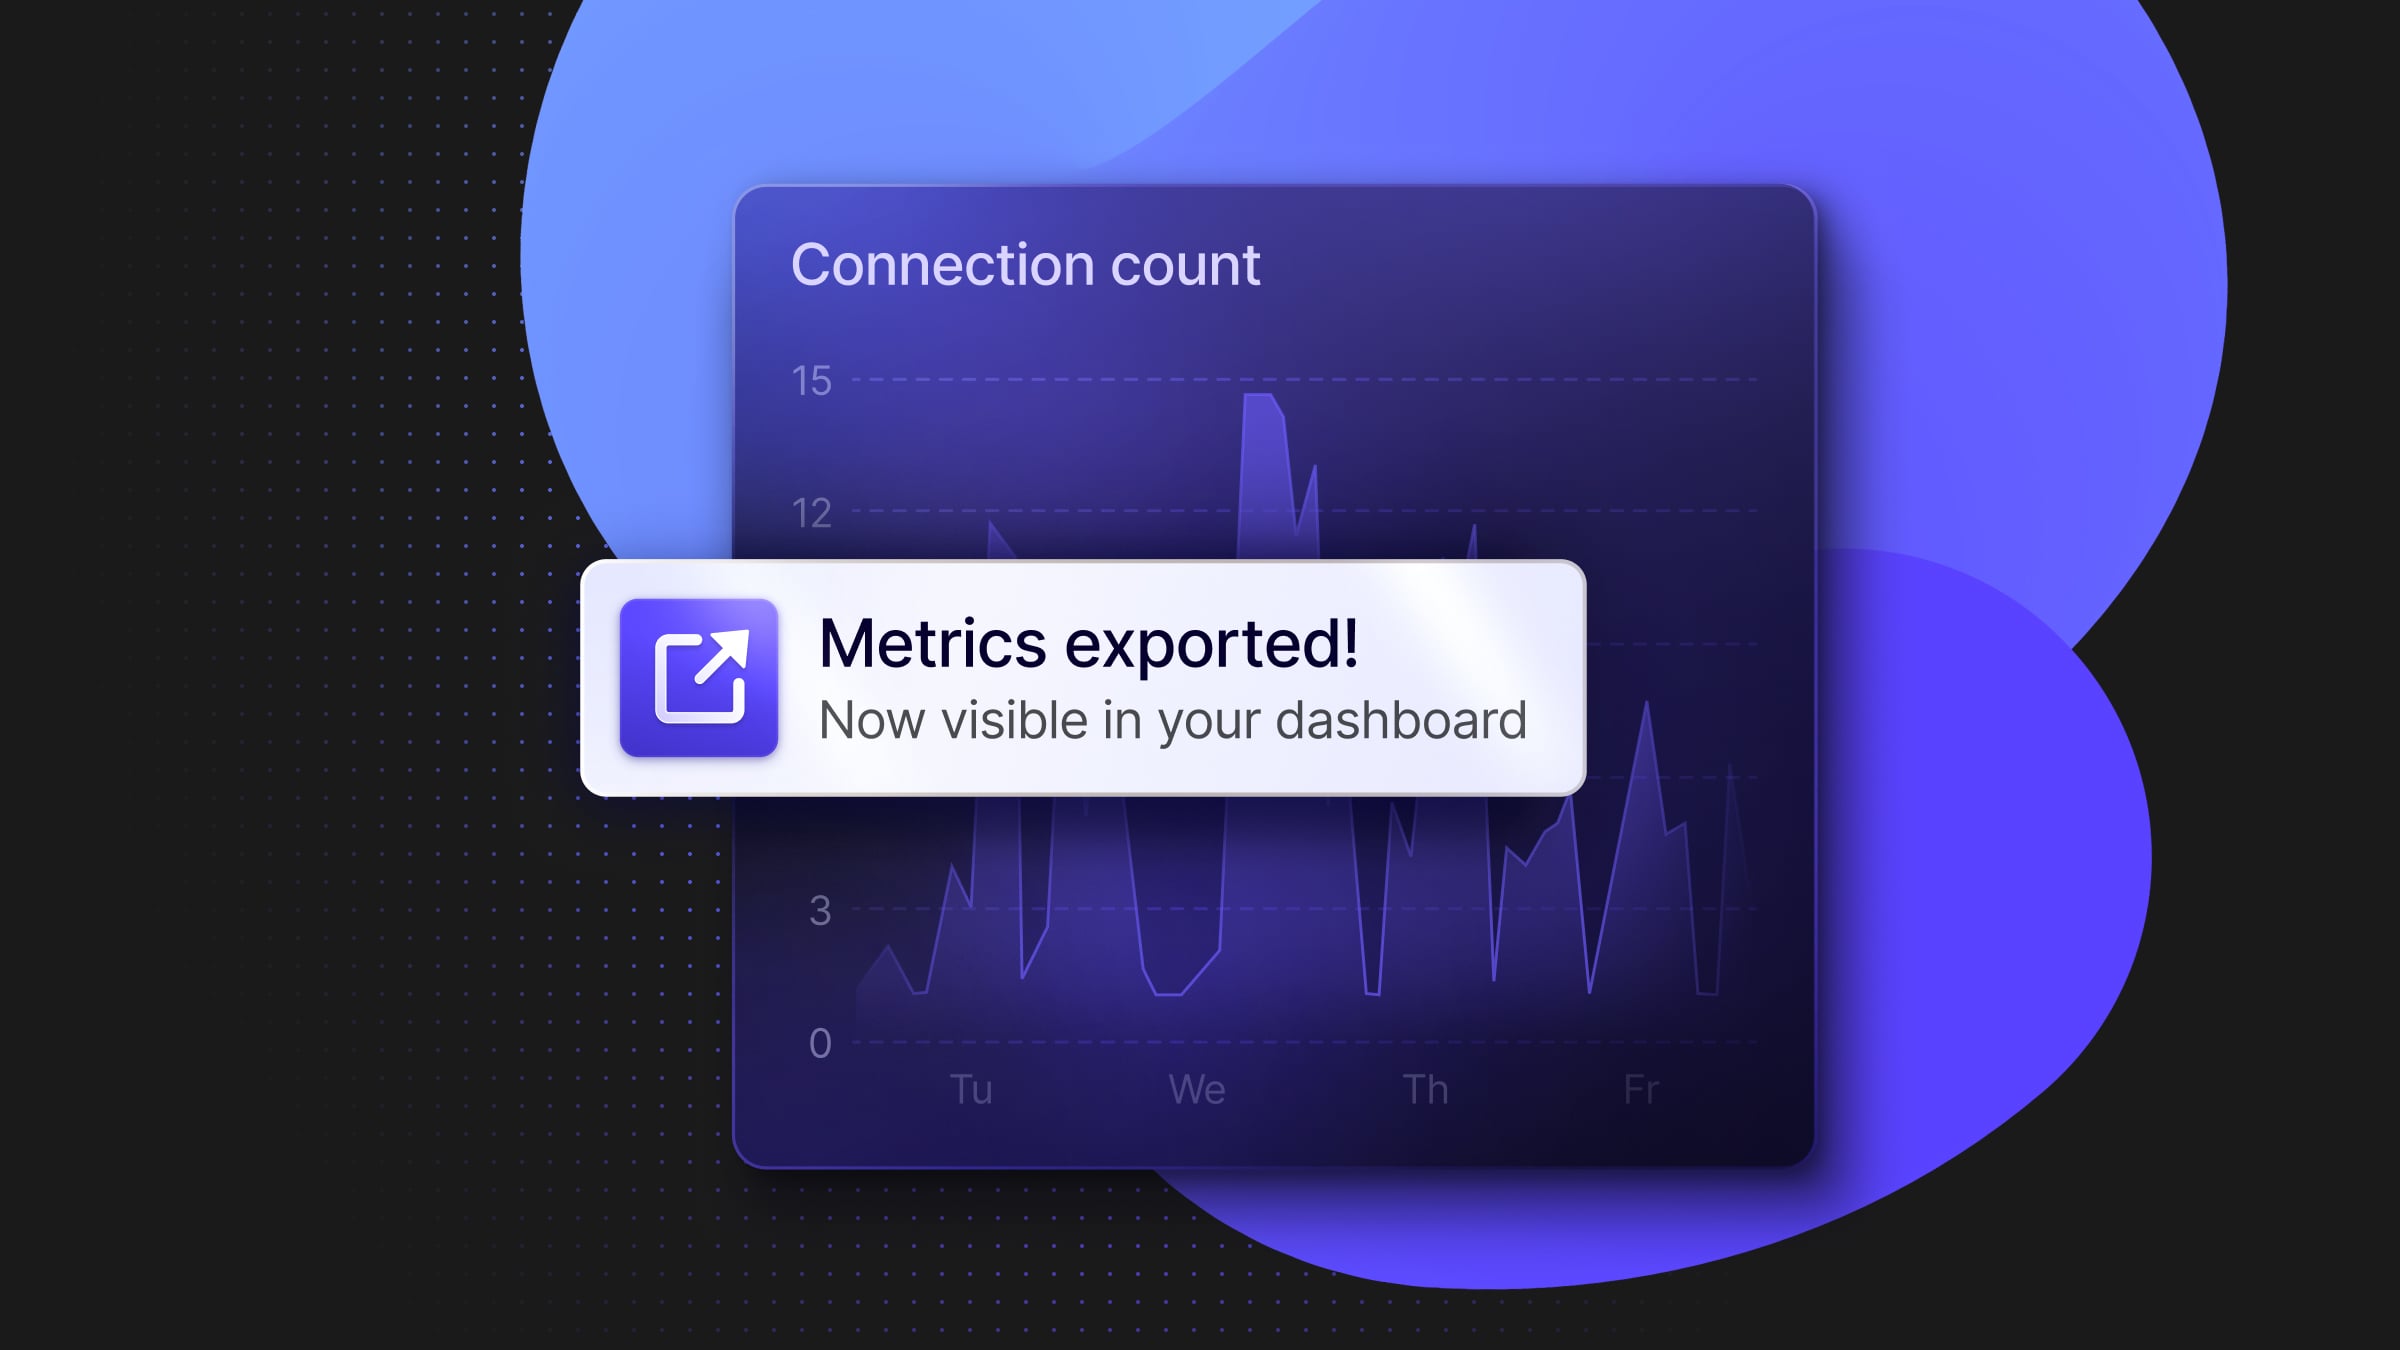
The metrics export feature we’ve built provides a seamless experience for our users. With just a few clicks, they can start exporting metrics to their preferred observability platform. This continuous, real-time export of metrics enables users to monitor their Postgres databases alongside other infrastructure components, making it easier to identify performance bottlenecks and optimize their applications.
Having Postgres metrics in the same observability platform as application metrics helps users see a complete picture of how their stack is performing.
From an implementation perspective, using the OpenTelemetry Collector proved to be an excellent choice. The configuration was straightforward, and the collectors have been running reliably in production for months without requiring maintenance.